LifeBetterOrganized.com doesn't just capture and store data. It converts that information to trends that show you what's happening in a way that columns of numbers can't.
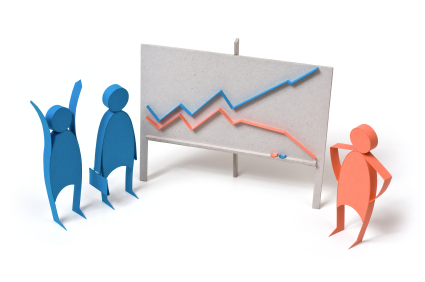
Expenses, exercise time, whatever: are they going in the right direction? Trend graphs show you what to reward and where to work harder.
A simple drag and drop activates the Trend function for every data category. You can also choose to display the trend as a line, bar or pie chart.
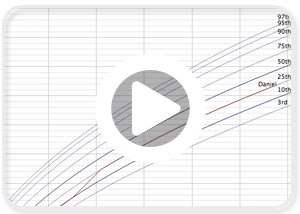
LifeBetterOrganized.com doesn't just capture and store data. It conducts trend analysis that you won't get anywhere else ... and turns it into easy-to-read charts and graphs. It lets you see at a glance how your child is doing in a way that columns of numbers can't.
The Trend function is available for every data category. Is her amount of exercise per week decreasing? Are his school grades going up, and is one subject a particular problem? Does her growth rate follow WHO standards? With Trends, you don't have to guess ... you will know..